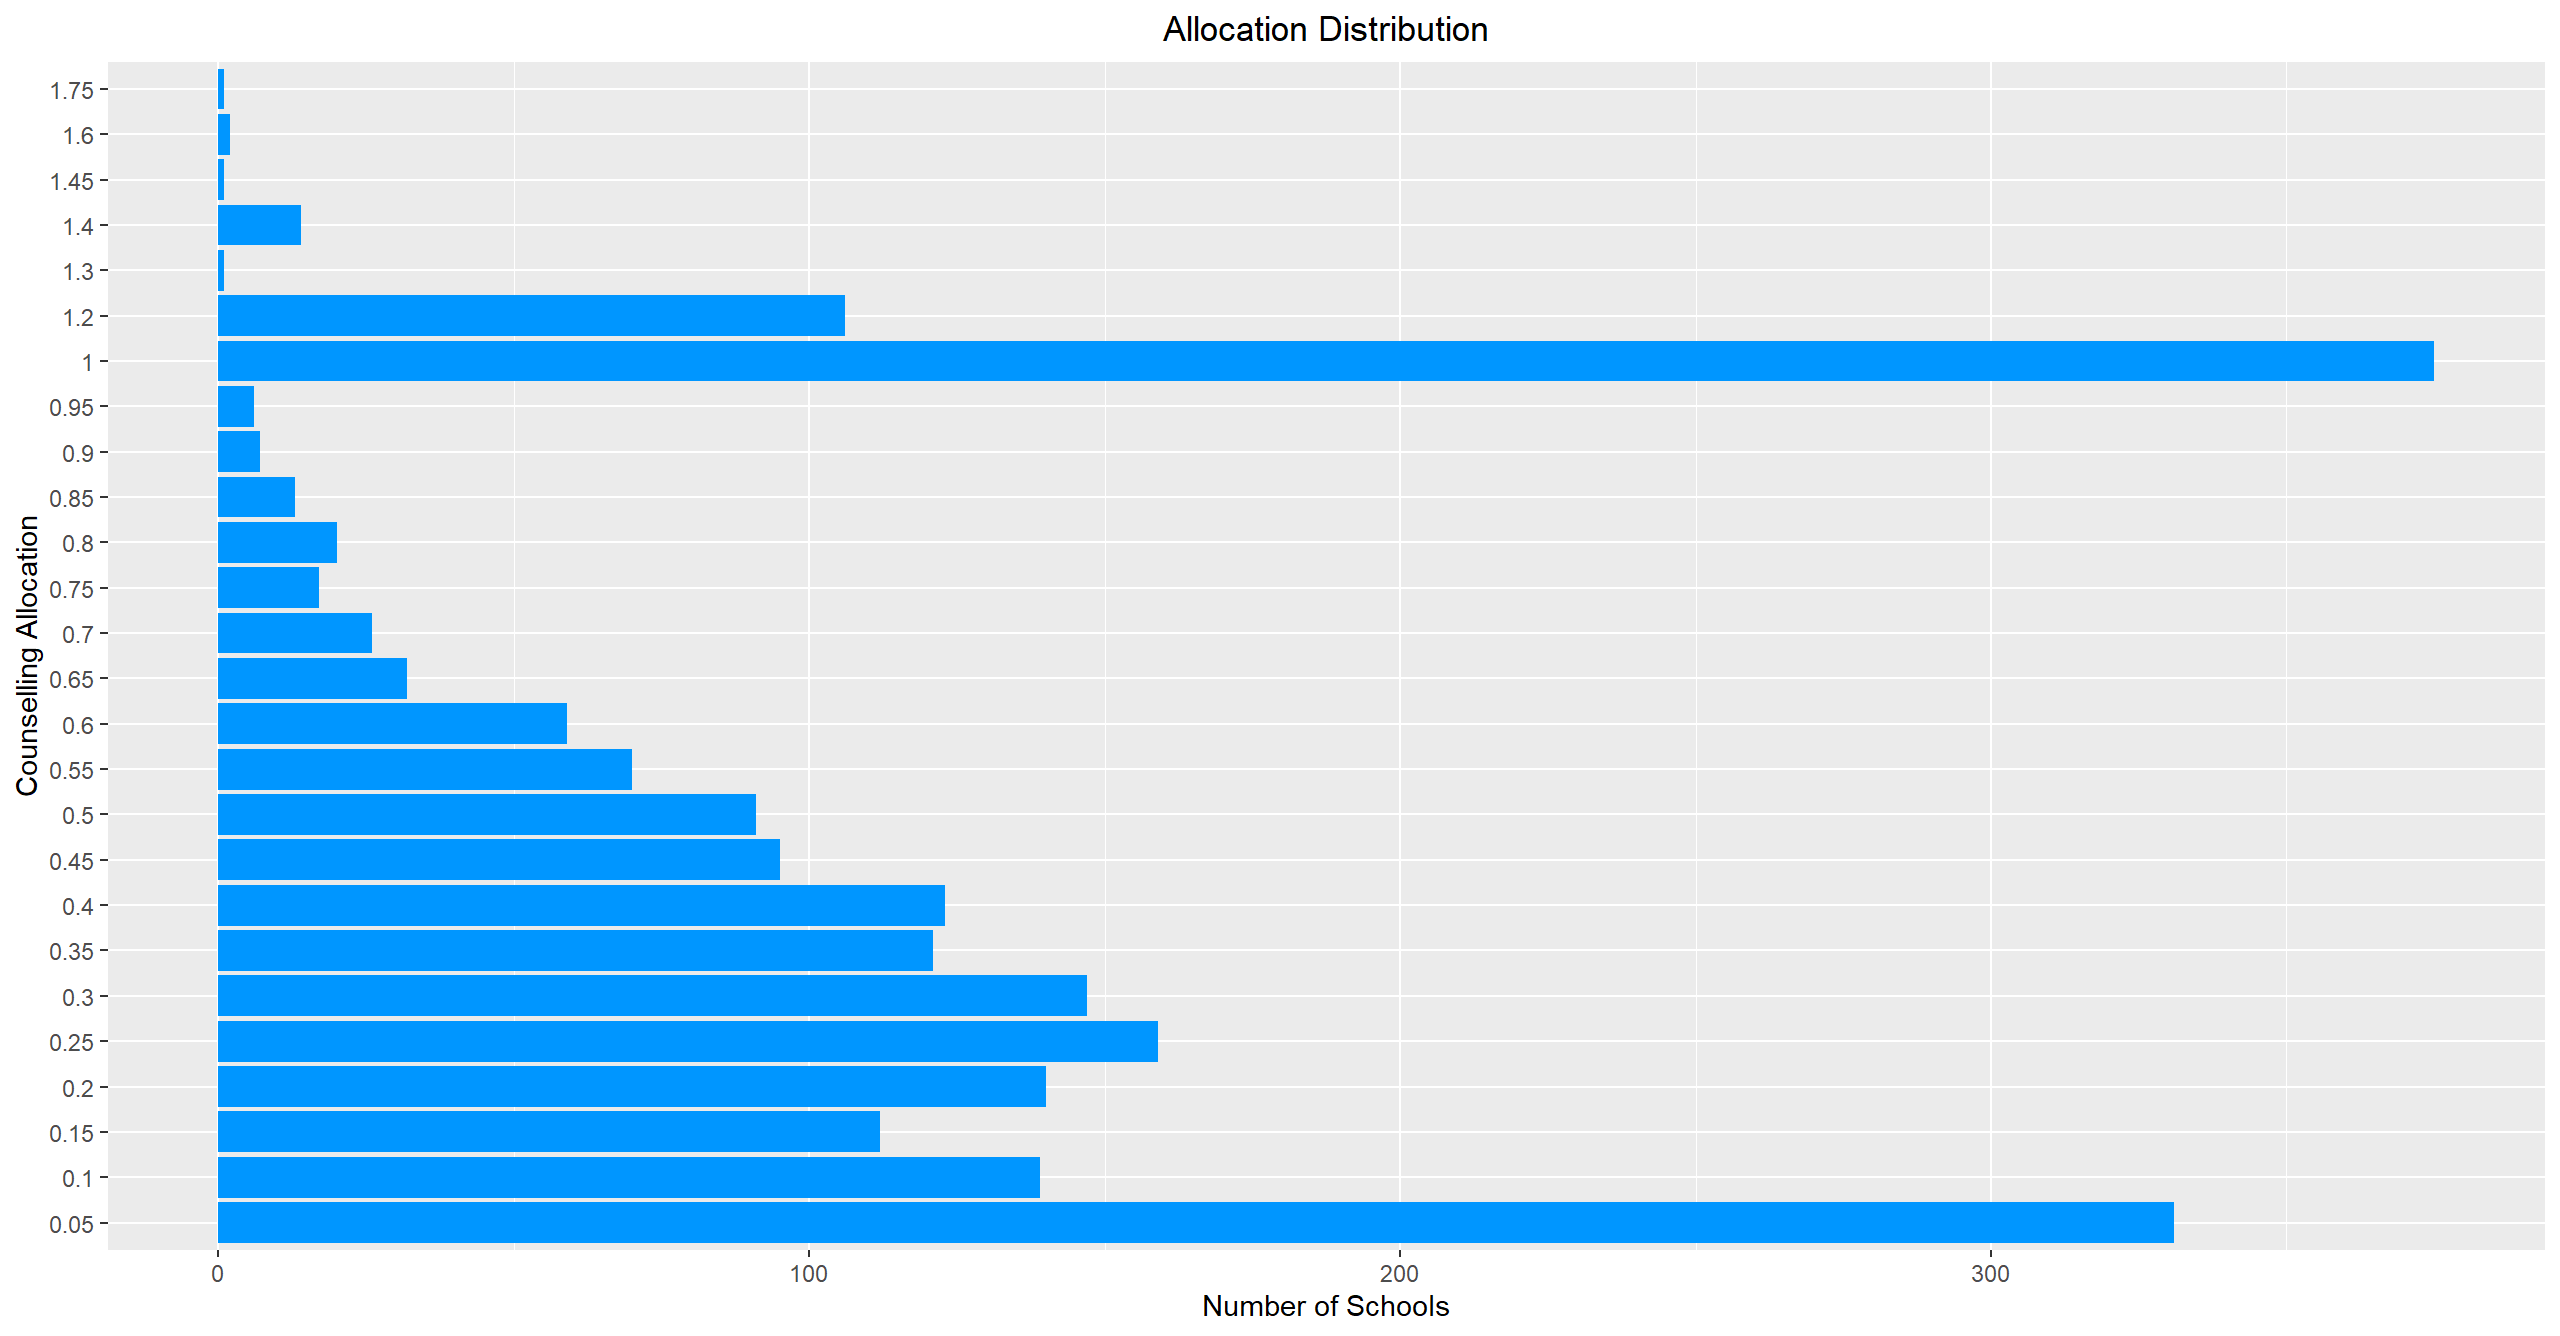
Bar Chart
      rm(list = ls())

      library('ggplot2')

      dataDF <- read.csv('C:/Users/....../AllocationDistribution.csv')
      str(dataDF)

      # Convert allocations to categorical variable
      dataDF$CounsellingAllocation <- as.factor(dataDF$CounsellingAllocation)

      # Plot bar-chart
      barChart <- ggplot(dataDF, aes(x=CounsellingAllocation, y=Numberofschools)) +
         geom_bar(stat = "identity", fill = '#0096FF') +
         coord_flip() +
         xlab("Counselling Allocation") +   # Label x-axis
         ylab("Number of Schools") +        # Label y-axis
         ggtitle("Allocation Distribution") +   # Add title to chart
         theme(plot.title = element_text(hjust = 0.5))   # Centre the title

      barChart
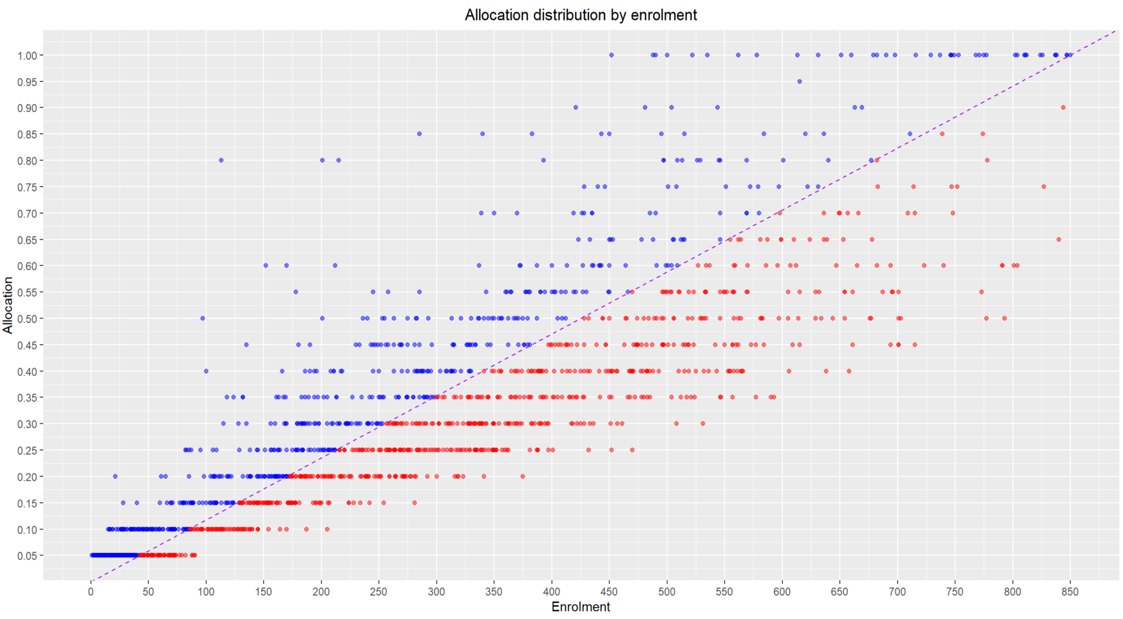
Scatter Plot
      rm(list = ls())

      library('ggplot2')
      library('dplyr')

      dataDF <- read.csv('C:/Users/.........../850.csv')
      str(dataDF)
      head(dataDF)
      colnames(dataDF)
      summary(dataDF)

      scatterPlot <- ggplot(data = dataDF, aes(x=Enrolment, y=Allocation)) +
        geom_point(color = ifelse(dataDF$Allocation < (dataDF$Enrolment/850), 'red', 'blue'), alpha = 0.5) +
        scale_x_continuous(breaks = seq(0, 850, 50)) +
        scale_y_continuous(breaks = seq(0, 1.0, 0.05)) +
        geom_abline(intercept = 0, slope = 1/850, color='purple', linetype='dashed') +
        xlab('Enrolment') +
        ylab('Allocation') +
        ggtitle('Allocation distribution by enrolment') +
        theme(plot.title = element_text(hjust = 0.5))

      scatterPlot